Showcasing Research and Business Results in an Annual Report
We designed, layouted and typeset the 2025 annual report as well as comprehensive infographics for The Extreme Light Infrastructure (ELI), a pan-European research institution for screen and printing.
Made for The Extreme Light Infrastructure.

For The Extreme Light Infrastructure (ELI), we took on the design, layout, and typesetting of their 2025 annual report. The 100-page publication combines economic and operational reporting requirements with detailed insights into the research and development activities at one of the world's leading laser research centers.
The report was completely redesigned in close collaboration with the communications department. The editorial design establishes a clear information structure and presents the research achievements in an attractive and professional manner. A flexible type area allows for a varied and almost magazine-like layout. Accessibility was always taken into account and is a fundamental component of DGA's design.
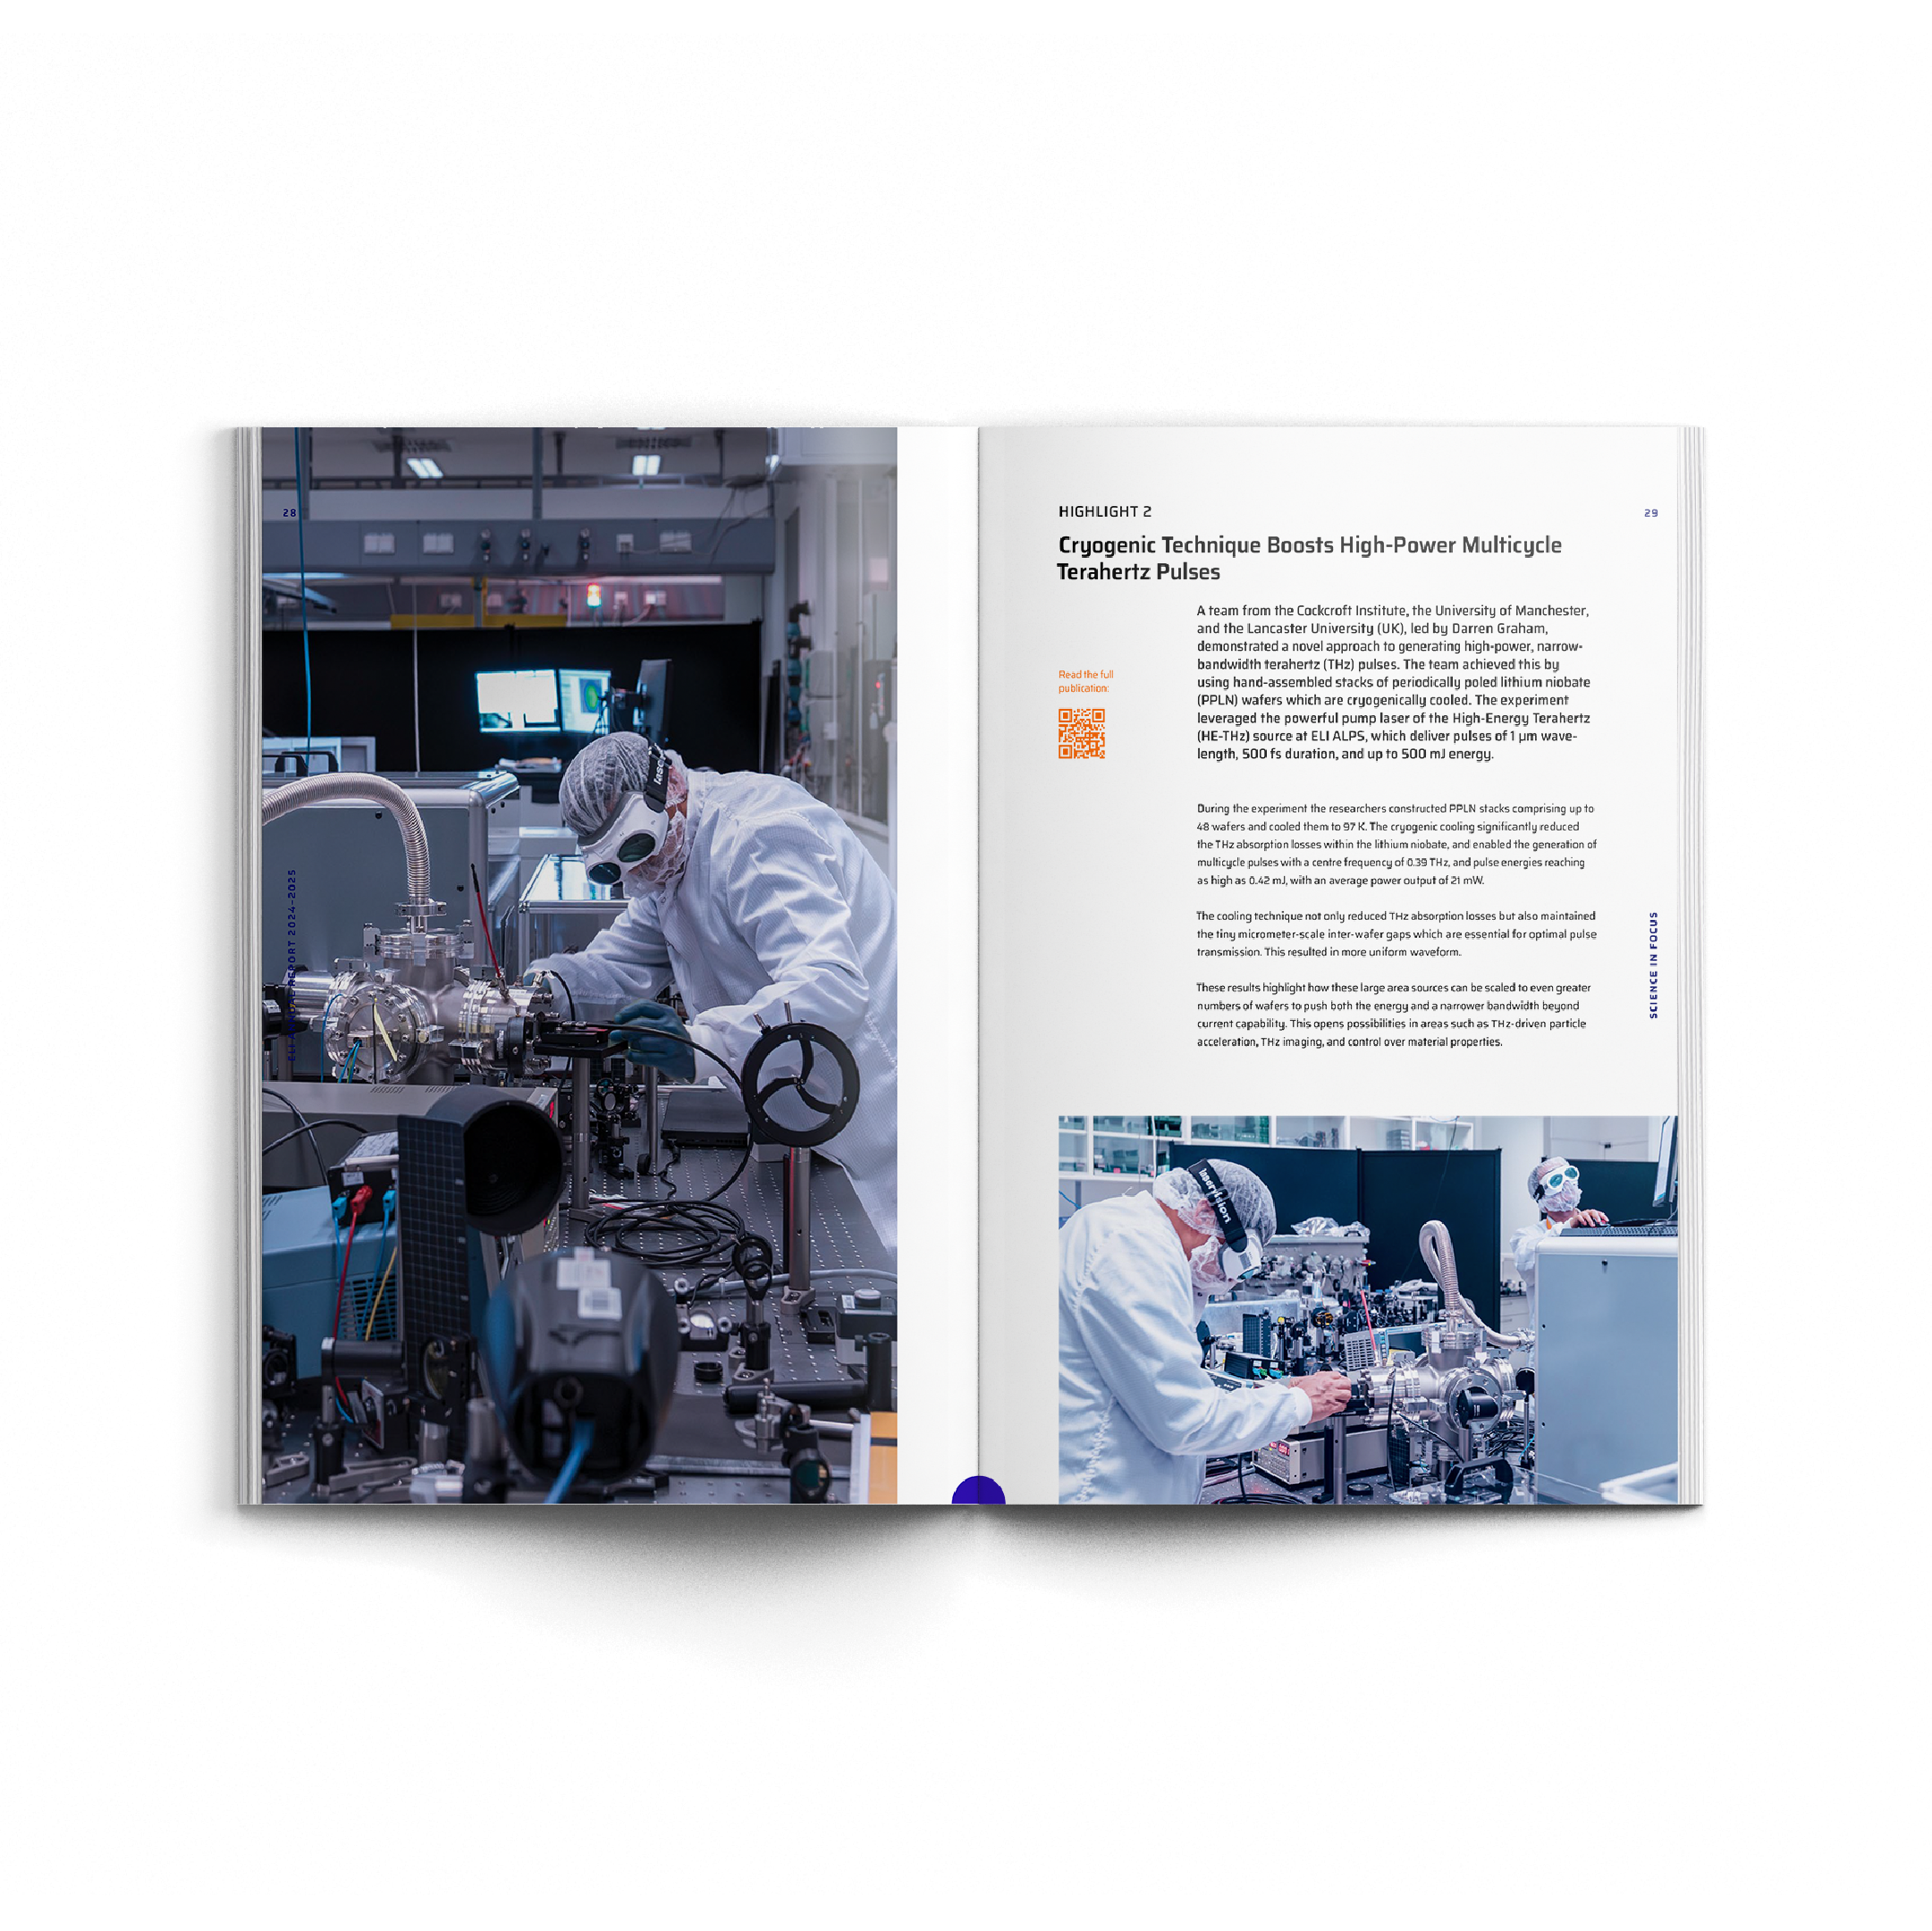
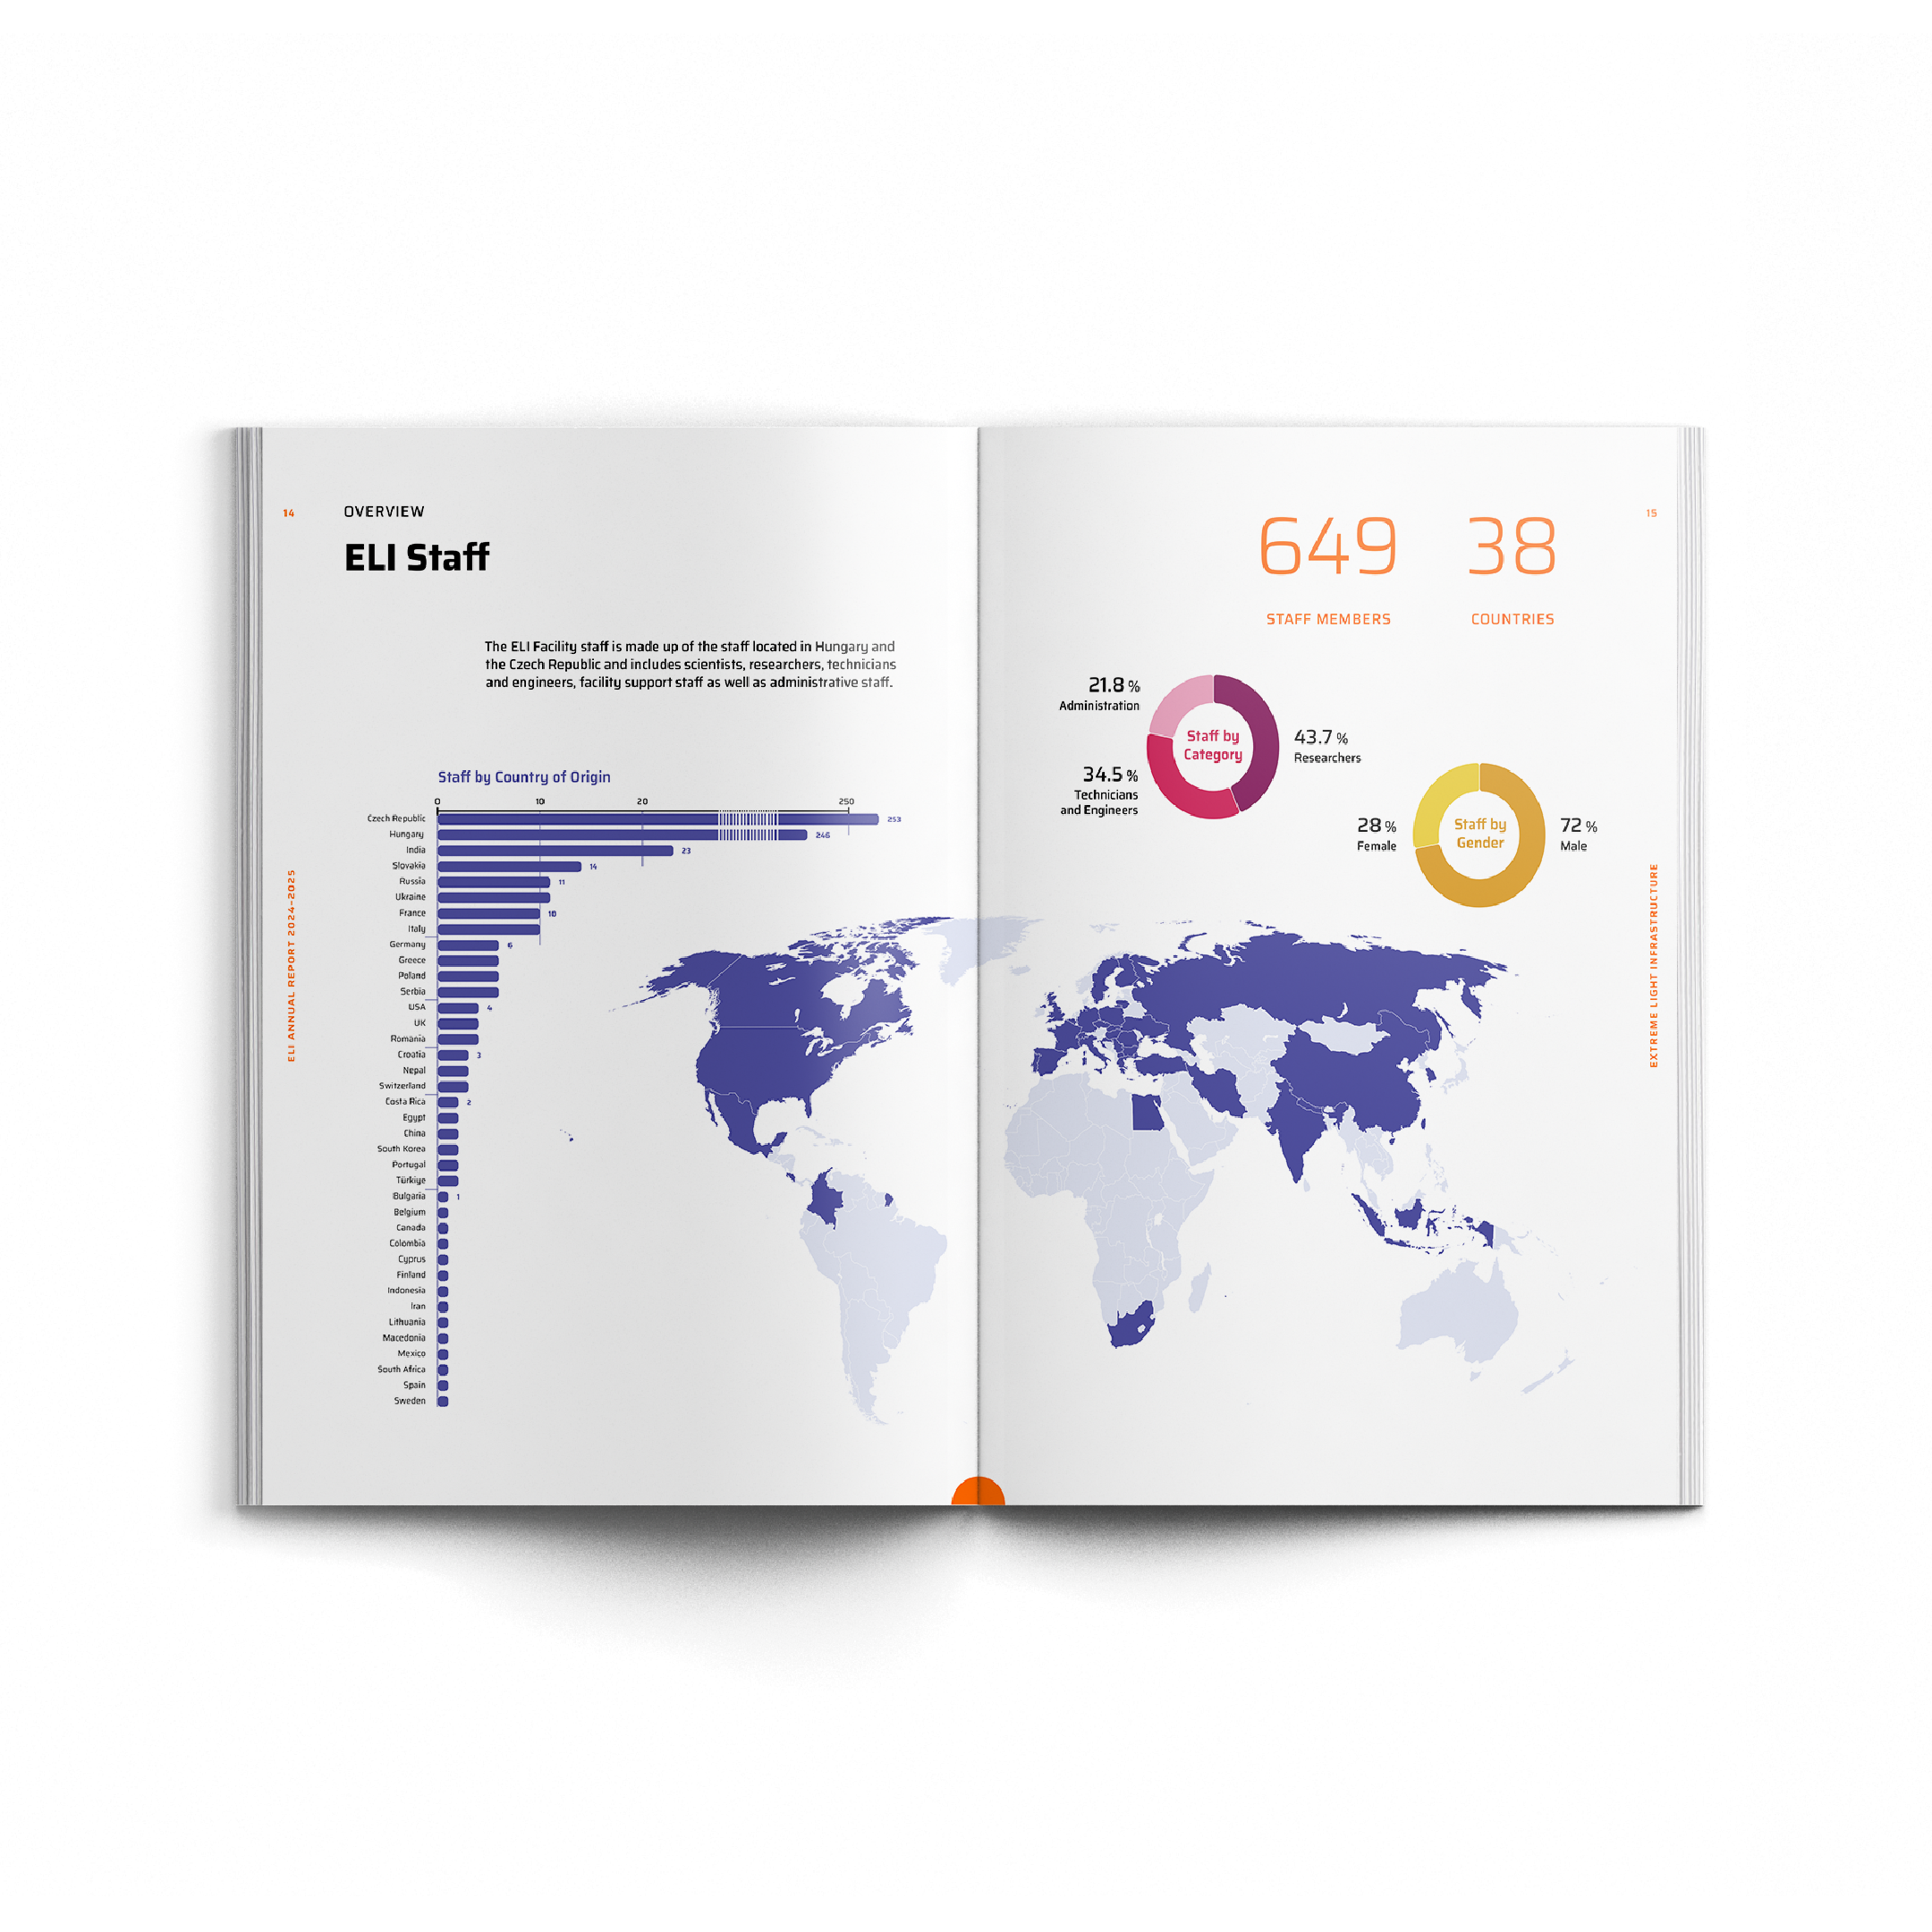
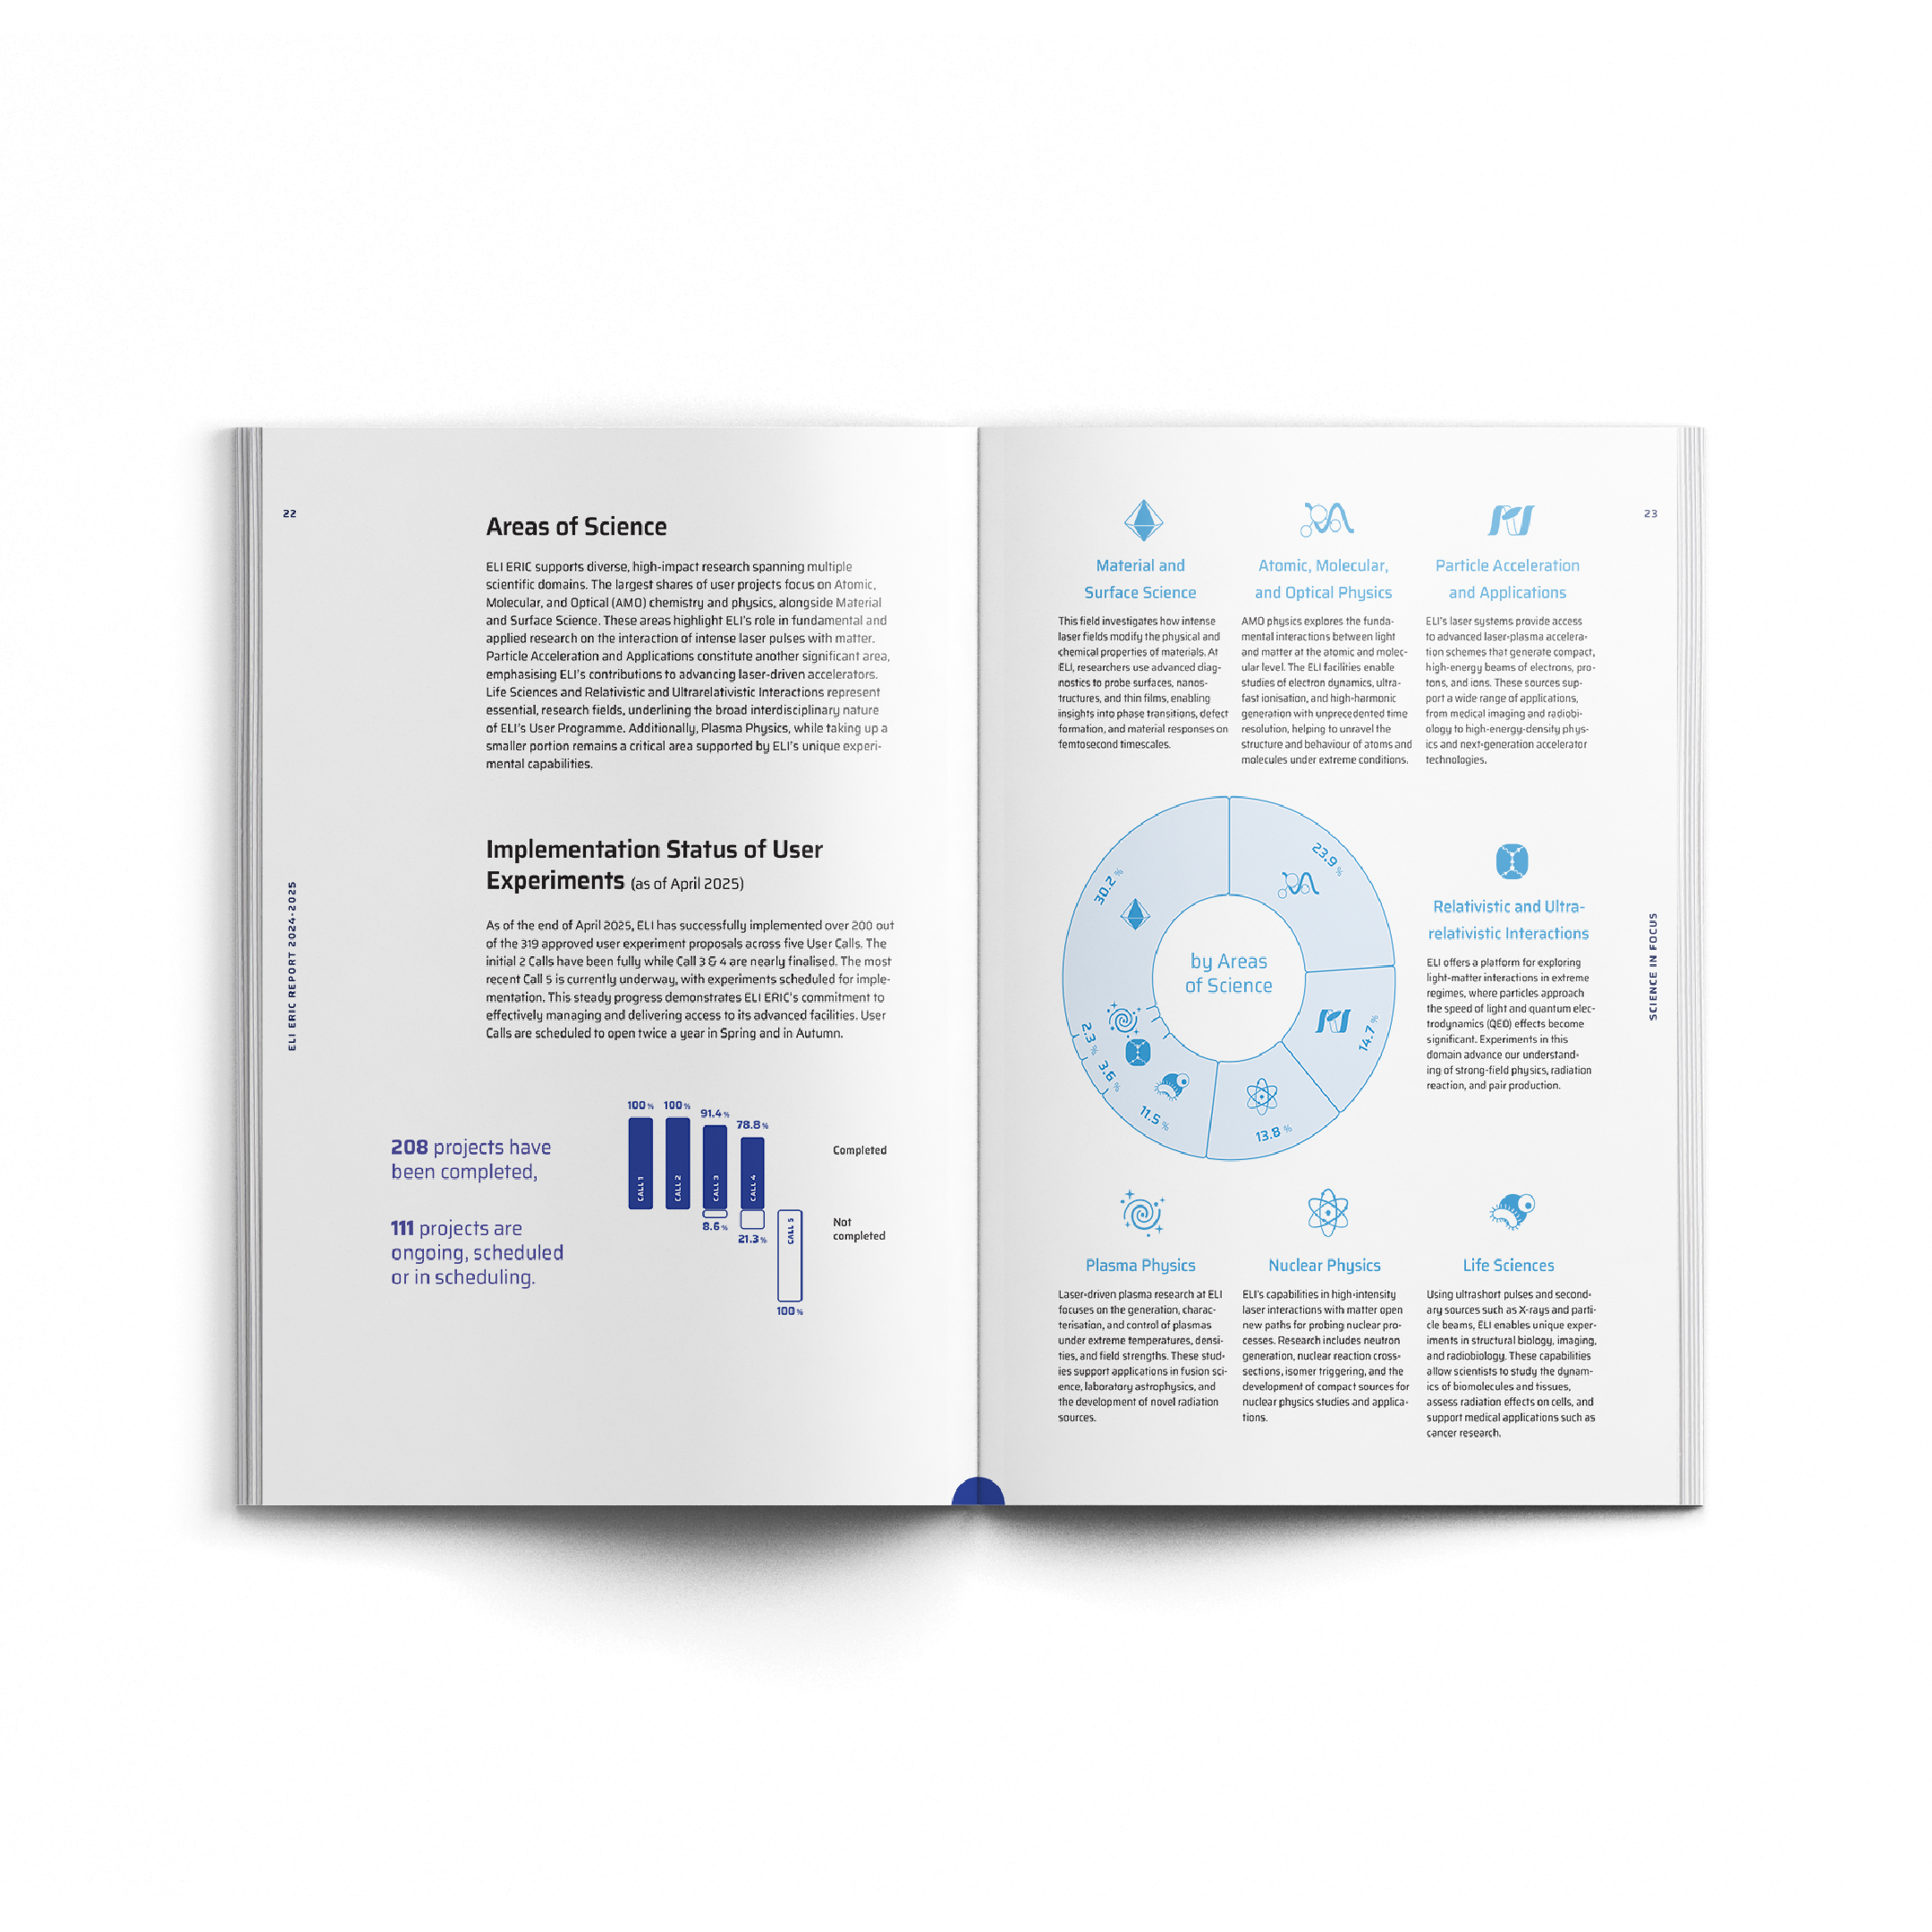
Complex information and research fields were visually presented using individually created infographics and icons. These graphic elements make complex topics much more accessible. When determining the visual language in the photographic area, the main focus was on providing a real insight into the facilities and everyday work of the researchers. In this way, the publication gains further authenticity and can adequately represent the content.